Top Ten Data Driven (partially)
One of the unique aspects of the current OWASP Top Ten is that it is built in a hybrid manner. There are two primary components to defining what ten risks are in the list. First is a data call cast out for organizations to contribute data they have collected about web application vulnerabilities found in various processes. This data will identify eight of the ten risks in the Top Ten.
In 2017 organizations contributed data that covered over 114k applications, for the 2021 data call, we received data for over 500k applications.
For 2024 we are hoping to grow yet again.
Why not just pure statistical data?
Why incidence rate instead of frequency?
There are three primary sources of data, we identify them Human assisted Tooling (HaT), Tool assisted Human (TaH), and raw Tooling.
Tooling and HaT are high frequency finding generators. Basically tools will look for specific vulnerabilities and will tirelessly attempt to find every instance of that vulnerability. This can generate high finding counts for some vulnerability types. Look at Cross-Site Scripting, it's generally found in two flavors; it's either a smaller, isolated mistake or it's a systemic issue. When it's a systemic issue, the finding counts can be in the thousands for an application. This drowns out most other vulnerabilities found in reports or data.
TaH on the other hand will generally find a wider range of vulnerability types, but at a much lower frequency due to time constraints. When humans are testing an application and they find something like Cross-Site Scripting, they will typically find three or four instances and stop. They can determine that it's systemic and write up the finding with a recommendation to fix on an application wide scale. There is no need (or time) to find every instance.
If we take these two fairly distinct data sets and try to merge them on frequency, the Tooling and HaT data will absolutely drown the more accurate (but broad) TaH data. This is a good part of the reason why something like Cross-Site Scripting has been so highly ranked in many lists when it's impact is generally fairly light, it's because of the sheer volume of findings. (Cross-Site Scripting is also fairly easy to test for so there are many more tests for it as well).
In 2017 we introduced using incident rate instead to take a little bit different look at the data and be able to cleanly merge Tooling and HaT data with TaH data. Incidence rate is basically asking what percentage of the application population had at least one instance of a vulnerability type. We don't care if it was a one-off or systemic, that's not relevant for our purposes; we just need to know how many applications had at least one instance. This helps provide a cleaner view of what the testing is findings across multiple types of testing without drowning the data in high frequency findings.
What is your data analysis process?
We publish a call for data through social media channels that are available to us, both project and OWASP.
On the OWASP Project page we list the data elements and structure that we are looking for and how to submit.
In the GitHub project, we have example files that can be used as templates.
We work with organizations as needed to help figure out the structure and mapping to CWEs.
We get data from organizations that are testing vendors by trade, bug bounty vendors, and organizations that contribute internal testing data.
Once we have the data, we are loading it all together and running a basic analysis of what CWEs are assigned to vulnerabilities. We will also look at how CWEs are grouped as there is overlap between some CWEs and others are very closely related to each other (ex. Cryptographic vulnerabilities).
Any decisions made related to the raw data submitted will be documented and published to be open and transparent with how we normalized the data.
We will look at the eight categories with the highest incidence rates for inclusion in the Top Ten.
We will also look at the results of the industry survey to see which ones may already be included in the data, the top two votes that aren't already included in the data will be selected from the other two places in the Top Ten.
Once all ten are select, we will apply generalized factors like exploitability, detectability, and technical impact; this will be used to help rank the Top Ten in order.
Category Relationships
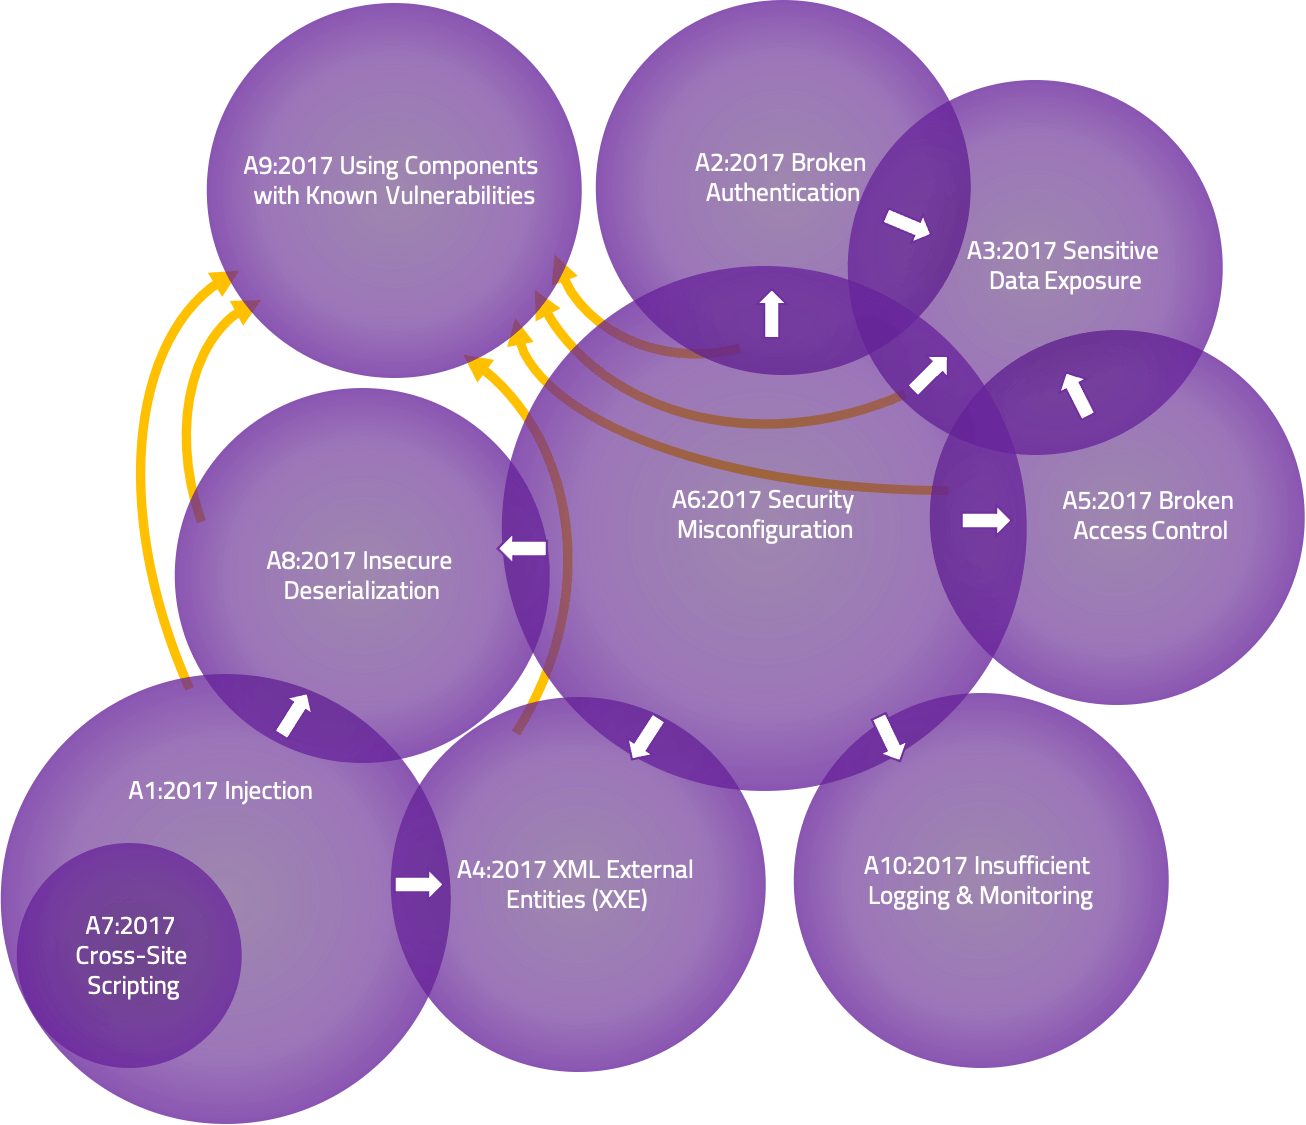
There has been a lot of talk about overlap between the Top Ten risks. By the definition of each (list of CWEs included), there really isn't any overlap. However, conceptually, there can be overlap or interactions based on the higher level naming. Venn diagrams are many times used to show overlap like this.
I drew a diagram that I think fairly represents the interactions between the Top Ten 2017 risk categories. While doing so I realized a couple of important points.
- One could argue that Cross-Site Scripting completely belongs within Injection as its essentially content injection. We are looking at the data for 2021 to see if it makes sense to move XSS into Injection or not (which we did).
- The overlap is only in one direction. Many times we will classify a vulnerability by the end manifestation, and not the (potentially deep) root cause. For instance, "Sensitive Data Exposure" may have been the results of a "Security Misconfiguration"; however, you won't really see it the other direction. As a result, I've drawn arrows in the interaction zones to indicate which direction it occurs.
- Sometimes these are drawn with everything in A9:2017 Using Components with Known Vulnerabilities. While some of these risk categories may be the root cause of third party vulnerabilities, they are third party risks and generally managed differently and with different responsibilities. The other categories are typically representing first party risks.
